#1
Wacky zei:Kun je dat dan eens onderbouwen ?
Give me numbers, graphs, etc...
For numerous reasons, volcanologists have been interested in CO2 release from volcanoes for years and have been working to improve estimates on the amount of CO2 entering the atmosphere and oceans by volcanic processes.
Carbon dioxide is released when magma rises from the depths of the Earth on its way to the surface. Our studies here at Kilauea show that the eruption discharges between 8,000 and 30,000 metric tonnes of CO2 into the atmosphere each day. Actively erupting volcanoes release much more CO2 than sleeping ones do.
Gas studies at volcanoes worldwide have helped volcanologists tally up a global volcanic CO2 budget in the same way that nations around the globe have cooperated to determine how much CO2 is released by human activity through the burning of fossil fuels. Our studies show that globally, volcanoes on land and under the sea release a total of about 200 million tonnes of CO2 annually.
This seems like a huge amount of CO2, but a visit to the U.S. Department of Energy's Carbon Dioxide Information Analysis Center (CDIAC) website (http://cdiac.ornl.gov/) helps anyone armed with a handheld calculator and a high school chemistry text put the volcanic CO2 tally into perspective. Because while 200 million tonnes of CO2 is large, the global fossil fuel CO2 emissions for 2003 tipped the scales at 26.8 billion tonnes. Thus, not only does volcanic CO2 not dwarf that of human activity, it actually comprises less than 1 percent of that value.
Bron: http://hvo.wr.usgs.gov/volcanowatch/2007/07_02_15.html
Ahh, ik zie dat ik een fout heb gemaakt. Die 200mil ton Co2 is globaal gezien. niet een enkele middelgrote vulkaan.
http://en.wikipedia.org/wiki/Hockey_stick_controversy
Hier wordt gesproken over de 'hockeystick grafiek' welke vaak nu nog als 'wetenschappelijk bewijs' wordt gebruikt in de politiek en door bedrijven, maar al enige tijd niet meer door daadwerkelijk wetenschappers. Dit is overigens dezelfde grafiek welke Al Gore presenteerde en waar hij de Nobel Prijs mee won.

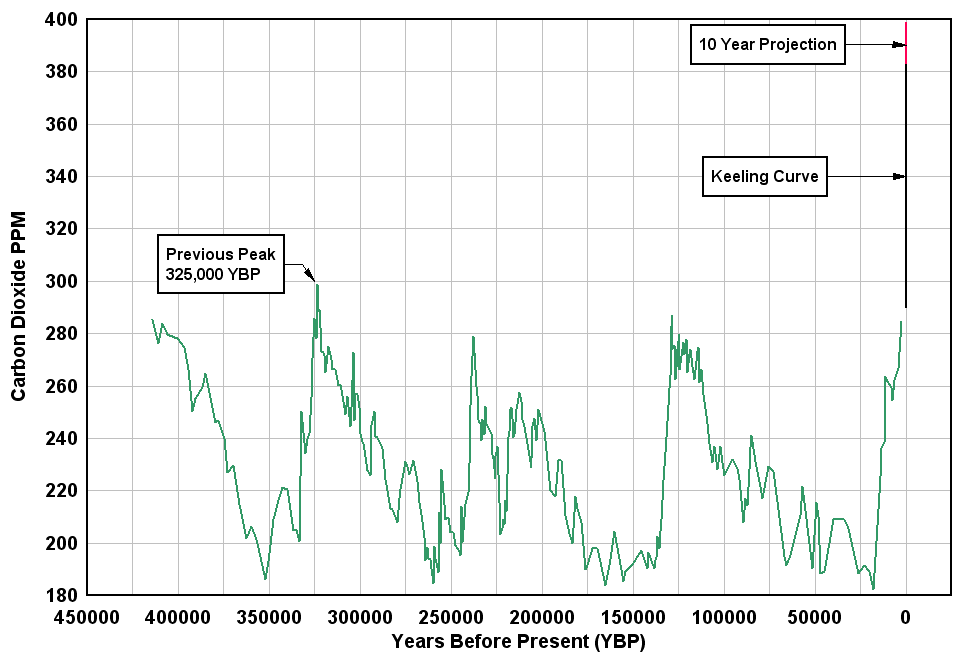
Dit is een grafiek welke temperatuur verschil met Co2 in de atmosfeer vergelijkt van een ander onderzoek. Hier is duidelijk te zien dat een hoger Co2 gehalte pas na de opwarming komt. dit verschil zit tussen de 200-1000 jaar. Zo'n 1000 jaar geleden hadden we de Middeleeuwse Warme Periode, dus een verhoogd Co2 niveau lijkt me sowieso aannemelijk.
Ik geef toe, kan ook niet anders bewijs genoeg, dat de mens een hele hoop Co2 produceert. Maar het is gewoon ronduit niet mogelijk om een accurate voorspelling te maken over hoe het 't klimaat verandert. Vooral sinds klimaat veranderingen toch wel enige tijd duren.
Bron voor het plaatje: http://www.warmingscaretactics.com/index.php?bShow=5&cat=4 (niet zo zeer de verdere informatie op de site, maar de grafiek had ik ergens anders gezien. Die site ben ik eigenlijk aan het zoeken, verwacht dus een edit.)

De gecorrigeerde temperatuur-'wobbel' in de afgelopen 2000-ish jaar (grafiek stopt in 1935). Deze laat wel zeker een trend zien in het veranderen van het klimaat. De huidige stijging gaat iets of wat sneller, maar ik zie niet echt een reden tot paniek.
Bron: http://www.worldclimatereport.com/index.php/2008/02/11/a-2000-year-global-temperature-record/